I like maps and diagrams and figures. They say things. They make things visible. But they also do things. There is always power involved in deciding what to represent and what to omit.
Here are some projects of mine.
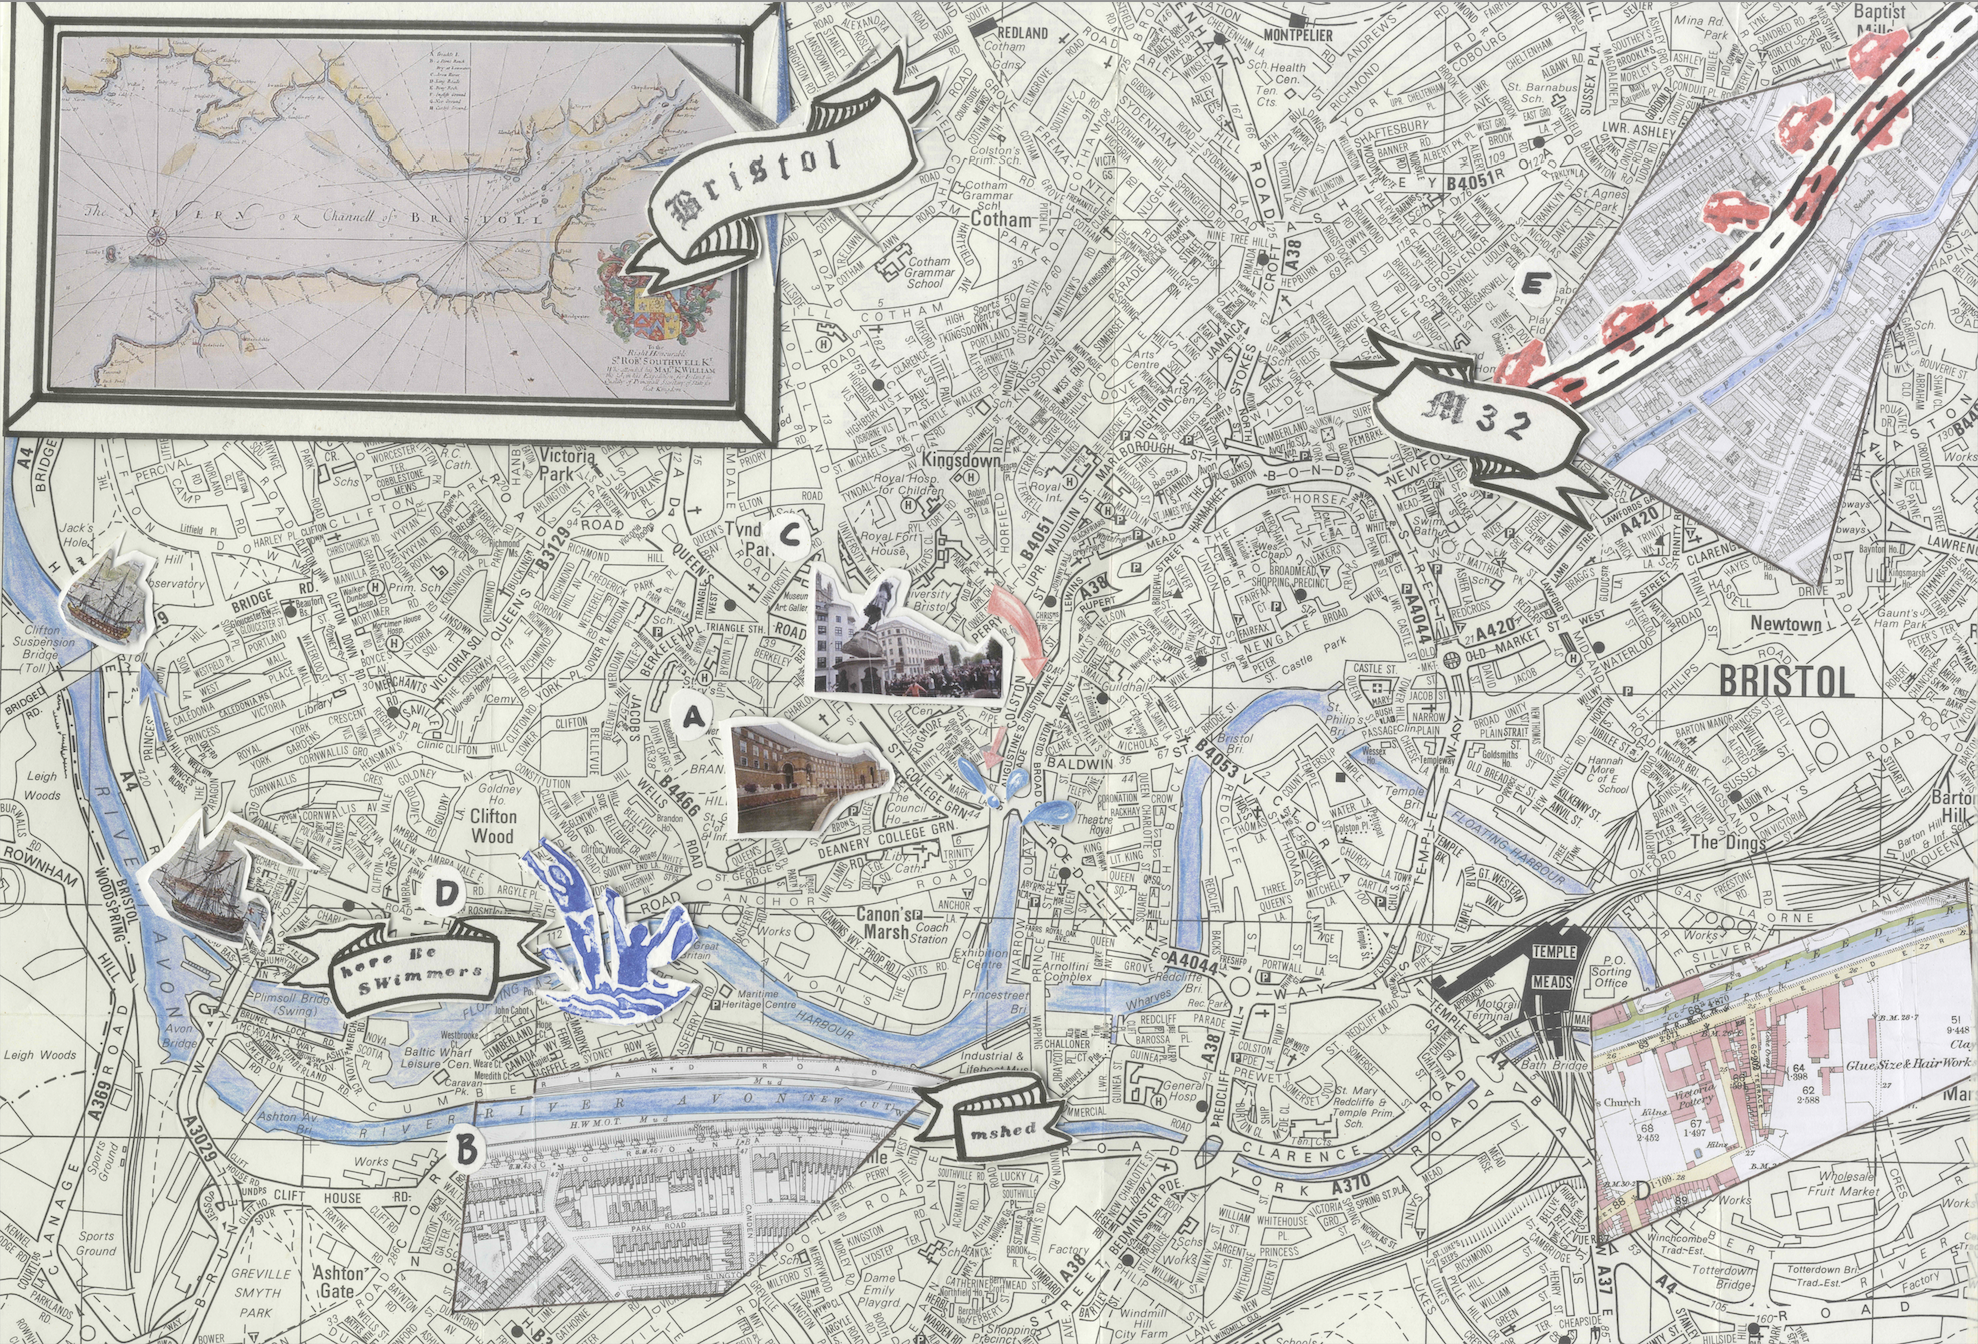
This is Bristol. I layered cut-outs of older maps on top of the current city centre. I did this to show how a history of urban and riverine development has given rise to a series of resistance movements: objections to racialised town planning proposals, BLM protests focusing on John Cabot, and wild swimming events protesting for better river health.
The map was designed for an environmental politics field trip for University Undergraduate students.
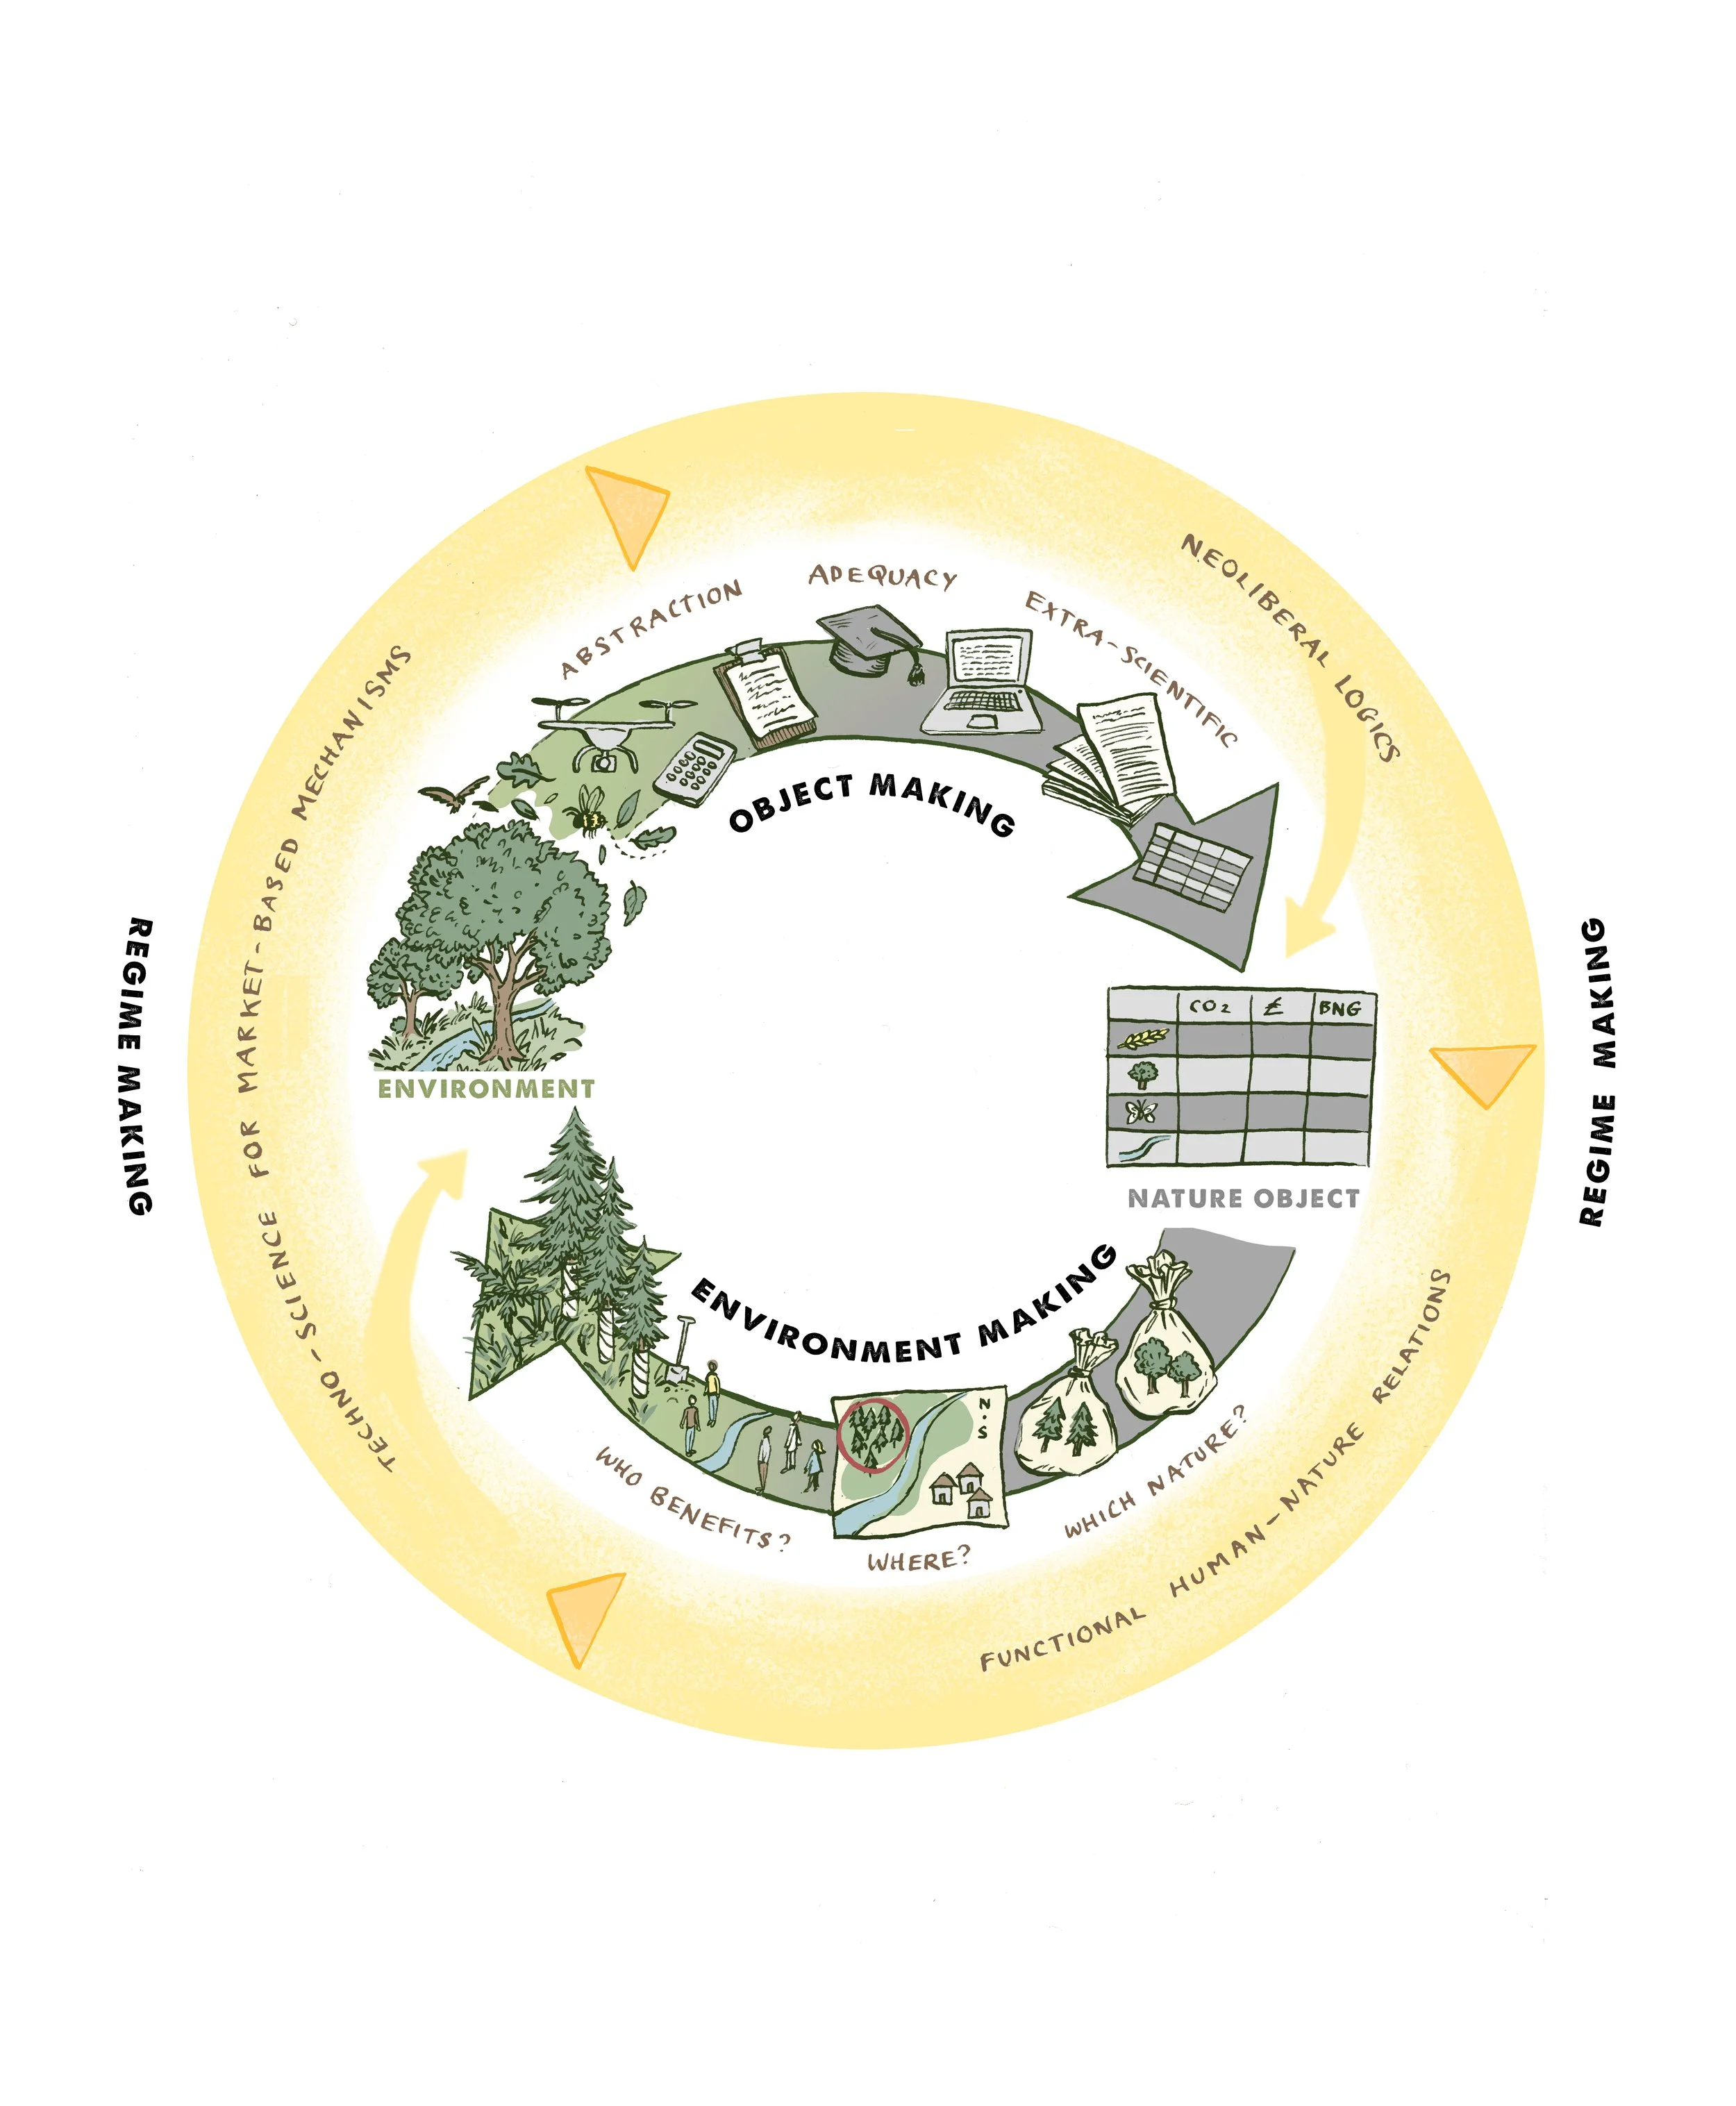
This is diagram to represent how nature, science, and capital interact. It shows different sorts of ‘performative happenings’ that take place as we look to solve environmental problems through market-based mechanisms
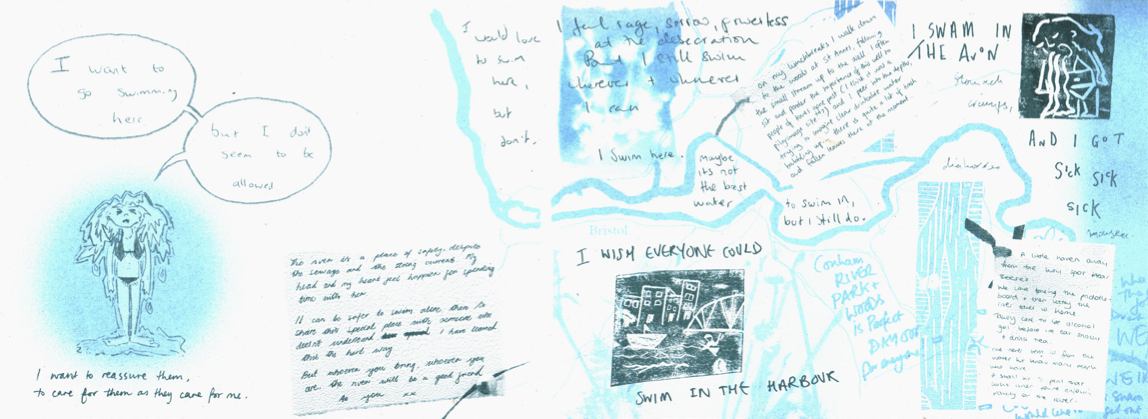
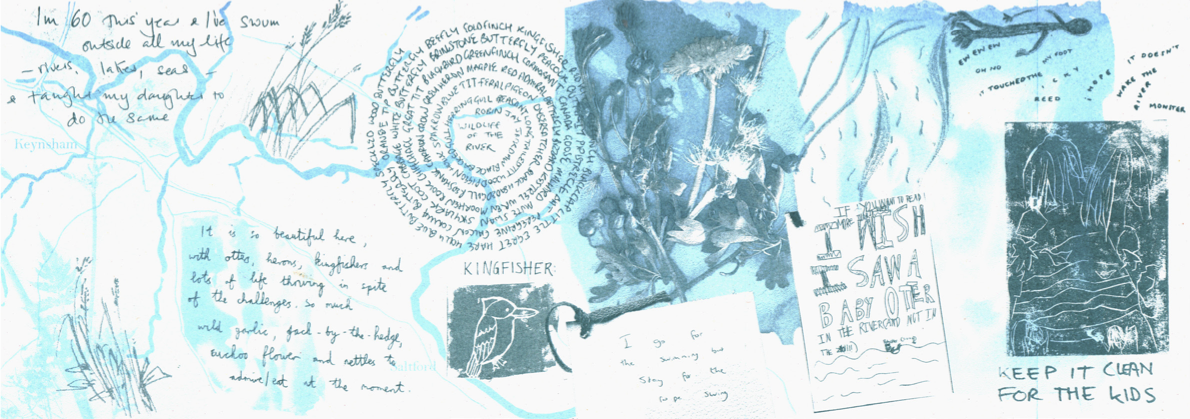
These are two pages from a zine. Each page has a section of the Avon River where snippets of stories, drawings, and pieces of art are tagged to parts of the River. The project came from a community mapping exercise where I brought environmental activists and wild swimmers together to reflect on river mismanagement in the UK and on their dreams for a river with a better bill of health.
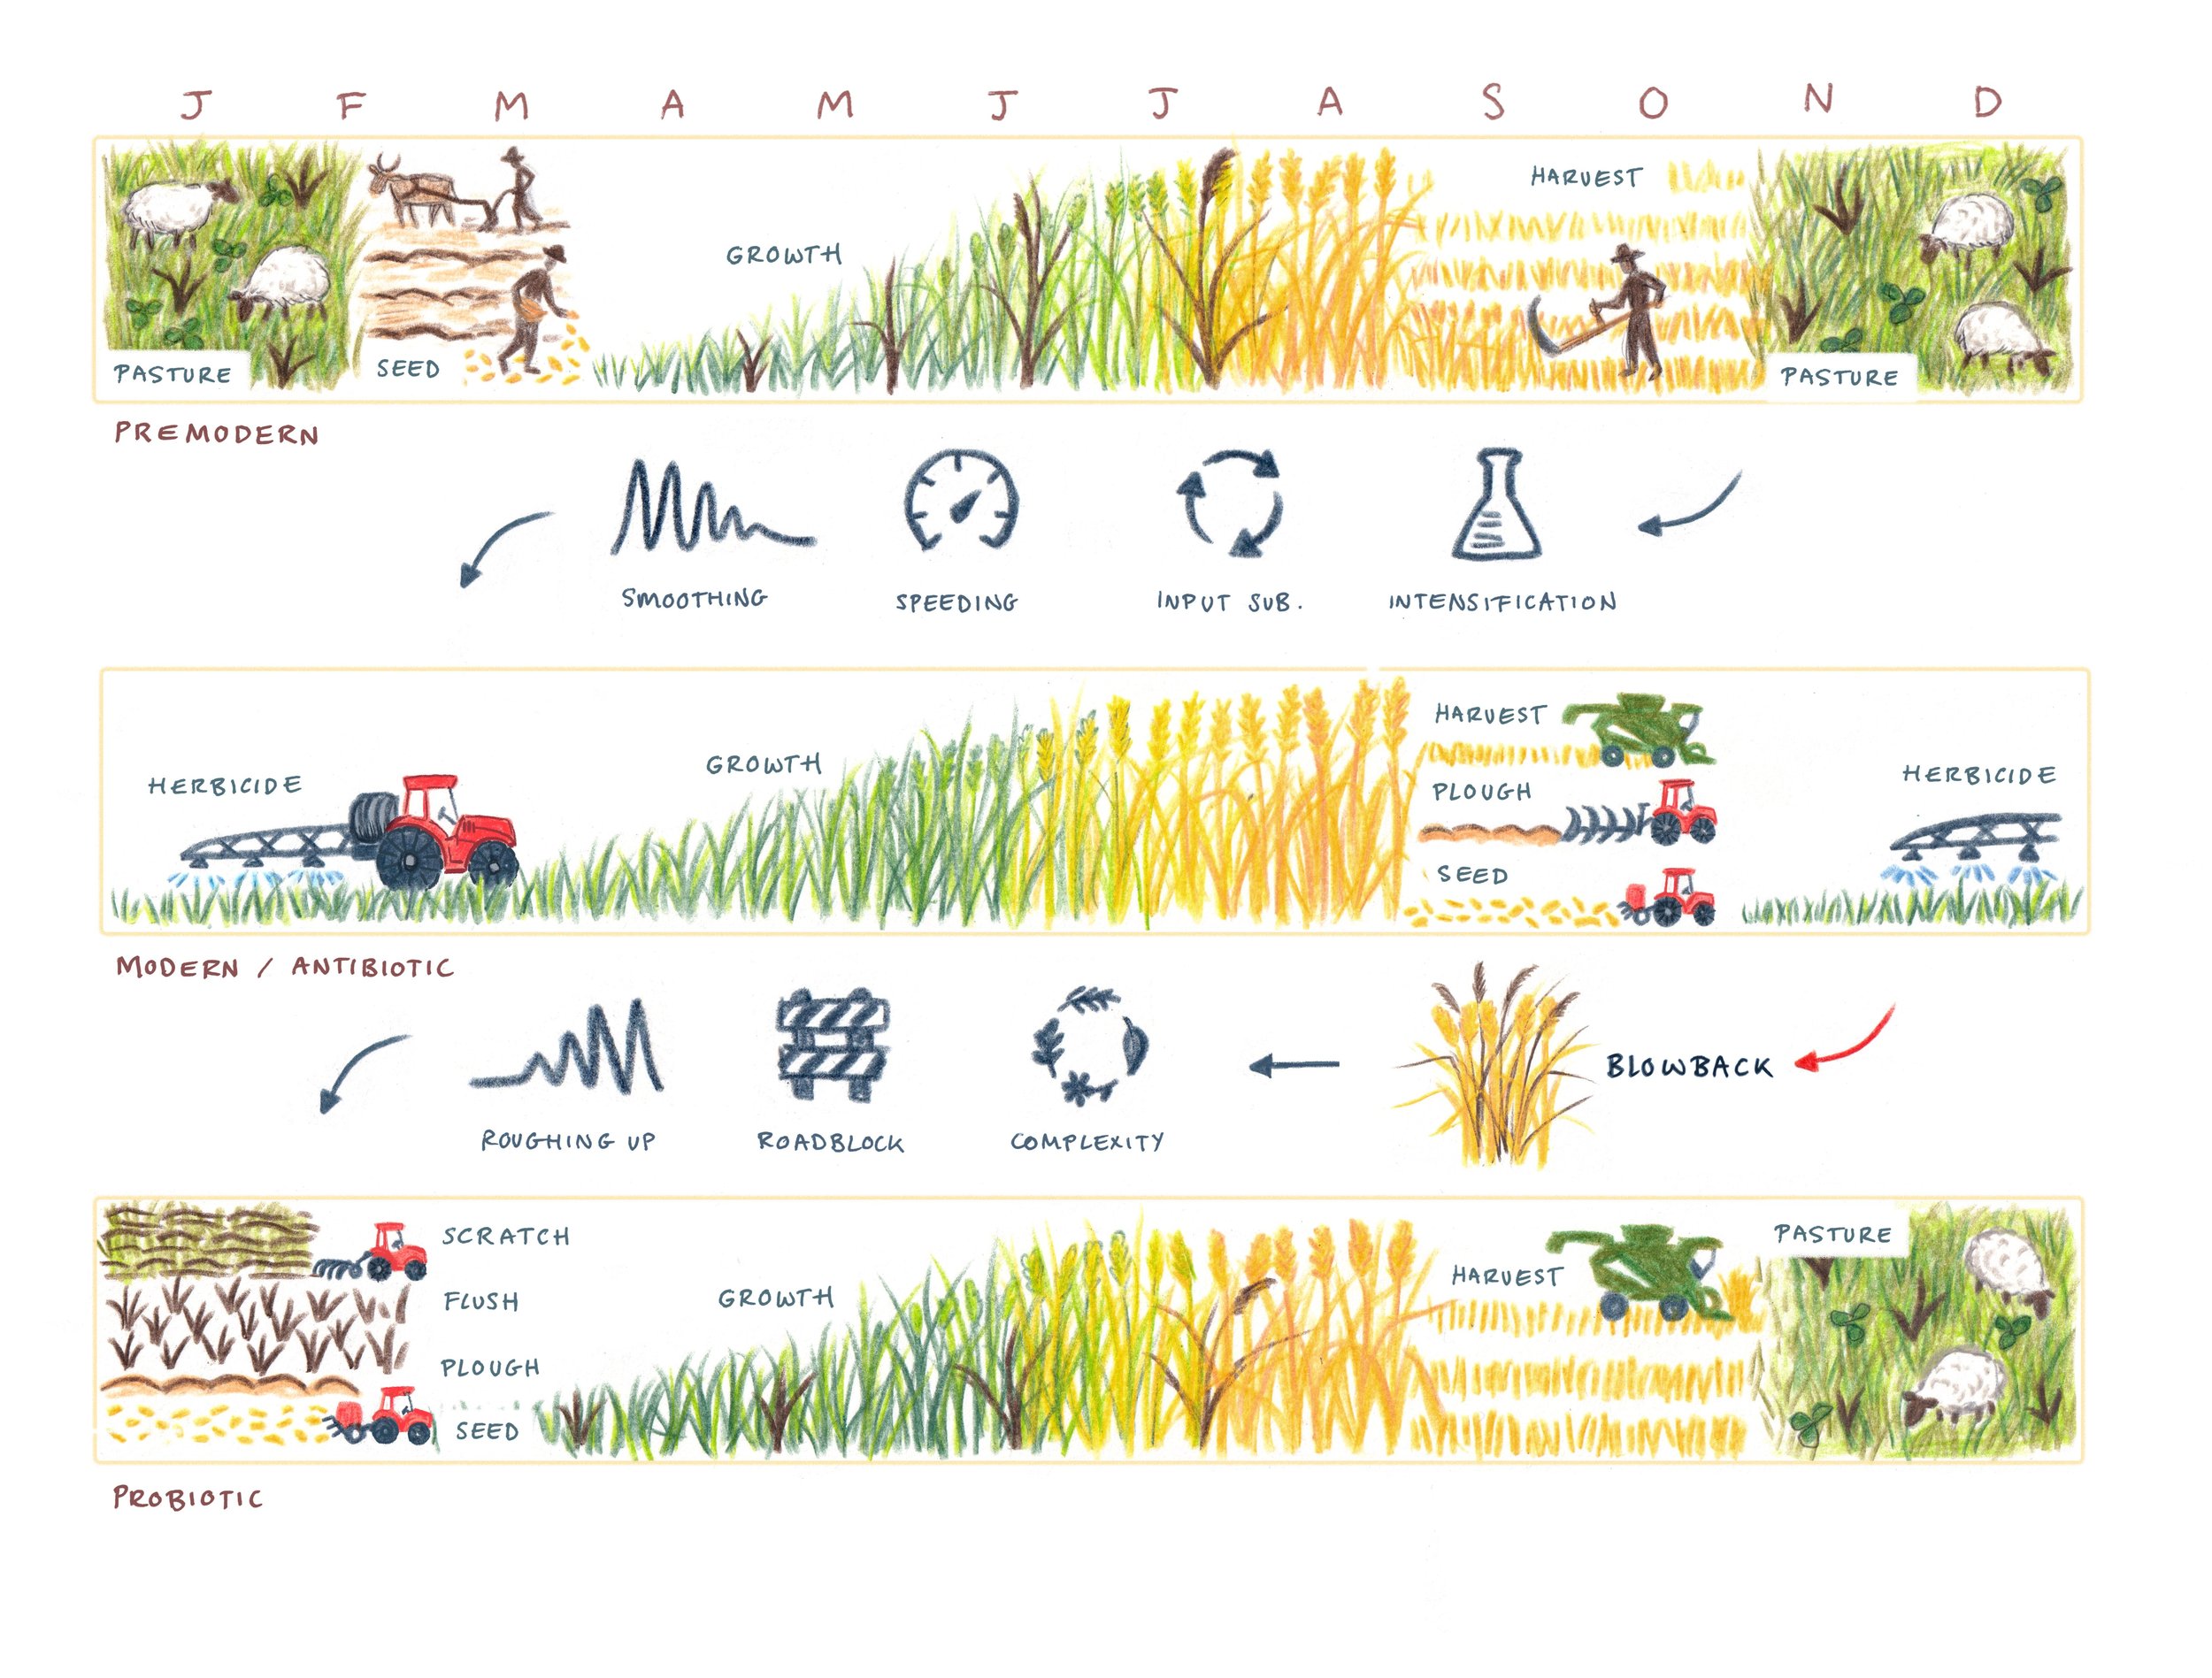
This is what I called a ‘disease meta-narrative.’ It shows how pre-modern farming systems managed soil fertility and pest outbreaks through diverse crop rotations and arable-livestock integration. It then shows how intensive systems removed many of the features that made for a healthy and resilient agro-ecosystem; and how innovative farmers are trying to reinstall some of those features to manage contemporary pests and diseases - particularly as pesticides become less effective and more politically proscribed.